A whole lotta AI content from AI companies with AI case studies about their AI products. 🤢
An up-and-to-the-right graph. But then, this:
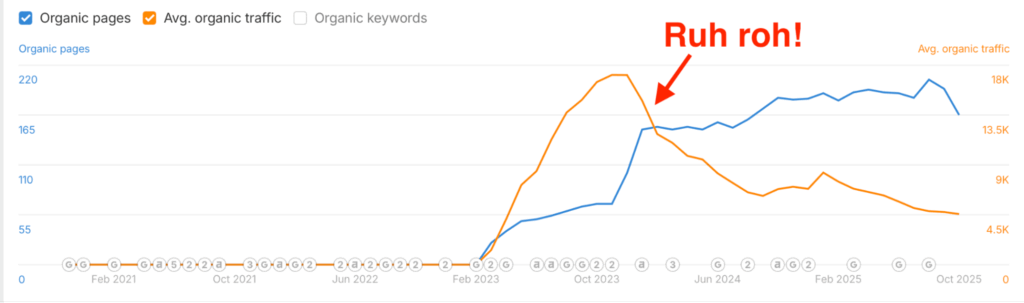
The only thing faster than a sudden spike in AI-generated rankings and traffic… is the complete unwinding of all said results.
Here’s the good news: Yes, you CAN and often should attempt to recover those lost positions.
But now for the bad: you actually gotta do a little work!
Here’s why.
AI slop ranking loss? Here’s how to resurrect it ASAP.
An enterprise B2B client recently had us look into their traffic decline.
The underlying reason was down to the “Oh aren’t we clever, let’s use AI to write sophisticated, complicated B2B content that’s supposed to build credibility with enterprise buyers” chestnut that was forced down every marketer’s throats over the past few years.
This is different from just the AI Overviews CTR impact, where ranking positions for content hasn’t changed yet traffic has. This is also different from presuming LLM discovery means traditional search demand is constricting (hint: it’s also not).
No, the ranking positions for these keywords — while initially promising — fell off a complete cliff.
Using the simple five steps below, we identified the top 25 articles (of many more) that were most strategic, considering:
- Strategic value and commercial value of each topic (see related: 47k AI topic analysis)
- Brand & product relevance to their unique selling proposition (USP)
- The overall traffic decline in both percentage and aggregate
- Relative SERP competitiveness to assess potential likelihood of regaining the ranking
- The estimated “time to results” (or when they might start seeing this traffic recover)
So, the bad news? There were LOTS of URLs that lost positions. (Rightly so, as I’m sure you’ll agree when you read the quality of the content in a moment.)
But the good news? You can strategically 80/20 a BUNCH of URLs in less than one hour if you know what to look for.
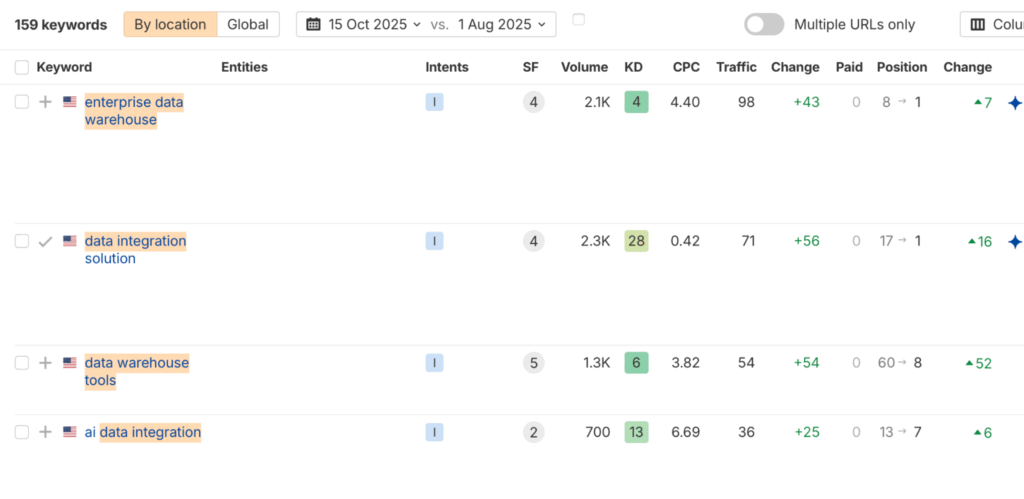
We reworked the top ~25 articles using the process below, then started republishing in August 2025. In less two months, many of these are already recovering first page ranking positions:
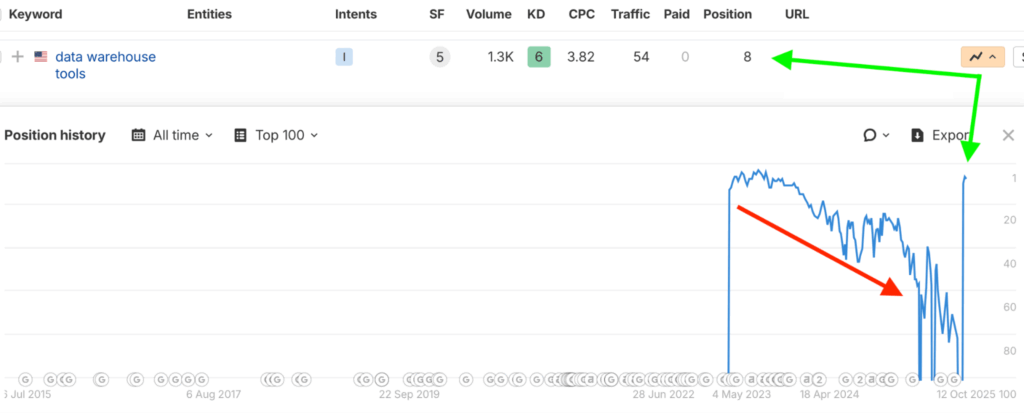
We’ll focus on one of these, the “data warehouse tools” query, to use as an example for each of the steps below.
Looking at the Ahrefs timeline, you’ll notice that although this content piece started ranking well initially, it quickly fell off a cliff – plunging the depths of 6+ pages deep.
AKA, where all AI slop eventually goes to die.
However, upon republish, it jumped back to position 8 almost immediately:

Here’s how to do just the same.
Step 1: Identify the traffic decline window
Before diving into page-level data, you need to pinpoint the exact timeframe of the traffic drop.
You should start by going into Google Search Console and using actual search traffic data. But in its absence, Ahrefs or Semrush are OK for directional accuracy.
Look up the top pages over the past two years, filtering for declines in traffic and declining keywords.
On larger sites, you should also add dimensions like URL path to help bring your focus from a few thousand to a few hundred pages.
Now notice the terrifyingly-obvious sloping line down in actual (or estimated) traffic:
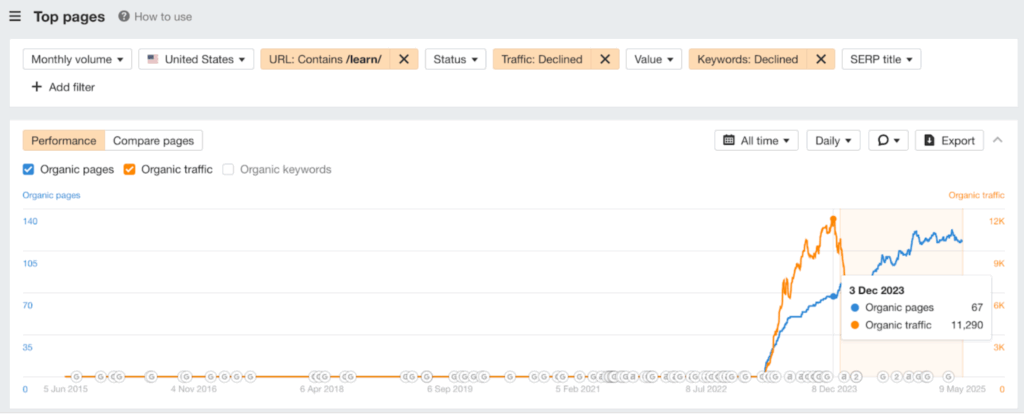
Note the date when the drop started (the peak) and compare it to the present or the lowest point of the trough. This gives you the specific time period to zero-in on the verifiable traffic decline.
Now, export this list and use a free tool like this:
- Traffic Recovery Model: a simple spreadsheet I made you can copy & customize (our internal ones includes tons of additional data points, a traffic gap analysis, and more).
- Loom video overview: a lame video of me explaining how this works and how to use it or customize it further to run through this same process outlined below
All you need to do is take the filtered information and paste it into a spreadsheet or a pre-built prioritization model like this, making sure to align all of the column data correctly.
As you scroll right, you’ll see the prioritization columns, which will help you quickly triage the issues in the next step.
Step 2: Prioritize your declined URLs
As a general rule, you should be focusing on pages that lost positions in the top five or top ten, as this is where the bulk of traffic stems from.
These will be URLs that fell from ranking 3rd, 4th, or 5th into the bottom of the first page, or even the second or third page. Where literally NOBODY goes now. Not even other LLMs thanks to the &num=100 parameter loss. 😟
Next, your objective is to sort the declining pages into buckets based on what you need to check or do to them.
Start with the obvious strategic value to your business: brand/product relevance, potential commercial intent, funnel stage, content type, etc.
(For instance, if HubSpot loses rankings for “leadership quotes”… who gives a F. They probably shouldn’t have bothered trying to rank for it in the first place.)
Then, from a search-driven perspective, here are a few questions to ponder:
A. Did the top keyword change? (high priority)
If the top ranking keyword for a URL changed, it often means the page used to rank for a much bigger, more popular keyword but is now ranking for a smaller variation.
Check whether the URL should have ranked for the more popular term in the first place or whether it’s more “accurate” now.
You’ll often see this with homepages on B2B sites that pick up a lot of product-focused, non-branded keywords, effectively cannibalizing dedicated product pages.
B. Is the estimated traffic loss significant? (high priority)
All statistics can lie. So be careful about arbitrary selecting percentages about one data point as the basis for bigger strategic decisions.
However, on larger websites (thousands+ of pages) and larger topics (thousands+ of searches), an estimated traffic drop of over 25% is pretty significant. It’s as good as any to start.
It’s also large enough (typically) to not be solely down to a negative AI Overviews CTR impact being the culprit (where actual ranking positions haven’t changed otherwise).
C. Is the content score lacking? (high priority)
A basic content score can help you quickly add an objective metric to assess the quality and completeness of your page’s coverage for the target topic.
Do NOT believe these numbers as the end-all, be-all. Keep each metric’s limitations and biases in mind. (As I’ll show you in the step below.)
But it can help you quickly assess relative starting points for dozens (if not hundreds) of URLs pretty quickly.
First, you’ll need to confirm whether the URL should even be targeting a specific keyword ranking.
Next, look at the content score to see what semantic keywords, related topics, ideas, and questions a user might be looking for, and determine if you cover those in the existing content.
If the content is missing these basic core elements, it’s typically a high-priority fix. (Read: easy quick win if you execute properly & quickly.)
D. Minor position drops (lower priority)
If the top keyword didn’t change and the estimated traffic loss is minor (e.g., around 9%), it’s probably just a slight position drop on the existing keyword.
Example: 4th position down to 6th position for the same keyword.
Possible causes also include a slight CTR loss from AI Overviews or other SERP features that push organic results down.
Minor updates, such as adding internal links or mentions, might be worth looking into. At some point. But it’s not a high priority compared to the other issues above.
“Data warehouse tools” example that pulls these ideas together
Using the model above, we noticed a URL with a strategically important keyword, and a 100% estimated traffic loss, due to a top keyword change.

The previous top keyword was the more popular: “data warehouse tools” while the new top keyword is only the miniscule, nerdy-abbreviation: “dwh tools.”
Upon further digging, we also noticed that this URL was last updated 2+ years ago (based on the original publish or last updated date).
To confirm it’s worth investigating further, we double checked the potential traffic gap to gain + commercial value for this keyword:
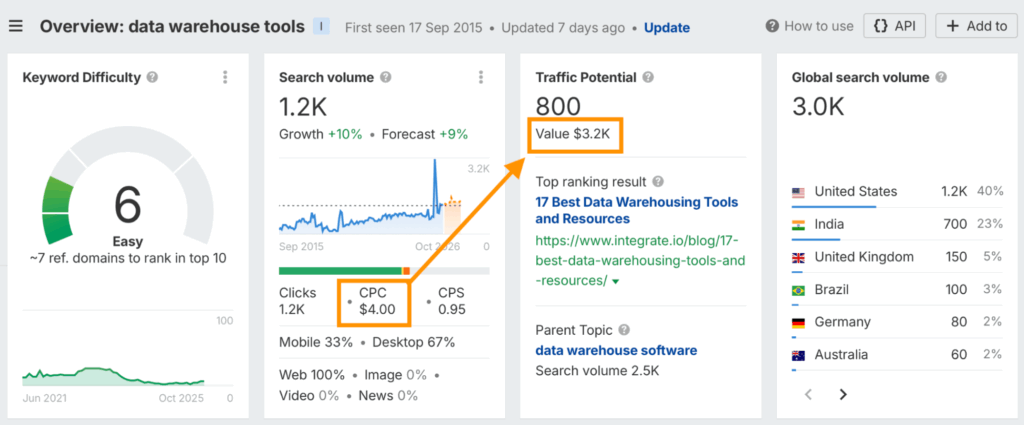
All checks out!
Let’s keep digging to see how we might update this URL to bring it back from the dead.
Step 3. Analyze the underlying issues to fix
Now, THIS is where content scores lie.
For instance, the previous article below “looks good” at 63% optimized, right?
Not until you actually read it!
Check out this 2005-level keyword stuffing:
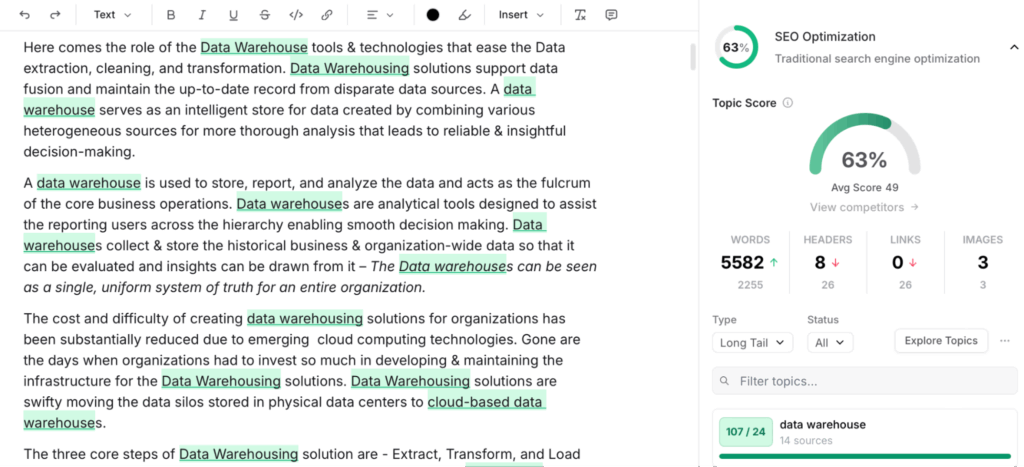
Honestly.
Read these sentences aloud to yourself right now:
This is god-awful writing.
Hate to be the bearer of bad news, but if you’re using AI to “write”… then the “writing” is going to be somewhere between the spectrum of mediocre-to-terrible.
And if someone thinks “AI writing is good,” it’s because they lack the actual skill or care to differentiate between what is good vs. bad writing.
Harsh, I know. But the first step is always acceptance of the problem.
Remember: the point of content isn’t rankings or citations or any of the other BS spewed around LinkedIn.
It’s to attract attention and build trust and credibility with potential customers. If you’re writing for sophisticated readers (read: bigger customers that pay more but also know more), this becomes even more critical.
Because they will see and hear and smell and taste bullshit from a literal mile away.
So, step back and ask yourself – what do readers actually want when searching for this query?
This is how we bridge the gap between traditional SEO or GEO or whatever the F you want to call it, and actual… marketing. And it’s how we train our team to think about writing for what readers want to read. Above.All.Else.
Here is the research our writer provided in the brief, prior to re-writing a single word.
A. Search intent
When people search for “data warehouse tools,” readers want:
- A curated list of top cloud data warehouse tools (Snowflake, BigQuery, Redshift, Synapse, Databricks, etc.).
- Quick feature, pricing, and use-case comparisons.
- Practical buying guidance: “Which one is right for me?”
- Neutral analysis, not just a vendor promo.
The key problem with the current [redacted_client_name] blog is that, right now, their “data warehouse tools” article lists ETL/ELT vendors (like [redacted_client_name] itself, Stitch, Boomi, SnapLogic, etc.) alongside actual data warehouses.
That’s why it isn’t ranking well; it’s mismatched to the keyword intent.
Users want to see Snowflake, BigQuery, Redshift, Synapse, Databricks SQL Warehouse, etc., compared head-to-head. But our current [redacted_client_name] blog lists integration tools and pipelines (Stitch, Talend, Informatica, etc.), which belong under “data integration tools” or “ETL tools.”
If we keep them, the page might not align with intent and could lose to competitors who stick to true warehouse platforms, just as a Postgres GUI comparison page would fail if it focused on databases rather than the interfaces people actually use.
B. SERP analysis
Next, our writer actually read through the existing content now occupying the top spots.
We want to understand what they’re doing well, what they’re not doing well, and how we can differentiate the new version to address these areas of opportunity.
- https://www.astera.com/type/blog/data-warehouse-tools/
Covers examples, features, and a list of warehouse tools. Includes a lot of explanatory text but mixes in vendors that aren’t strictly warehouses.
- https://www.integrate.io/blog/17-best-data-warehousing-tools-and-resources/
Listicle format with 17 tools. Blends actual warehouses with ETL and data integration tools. Limited comparison depth.
- https://thectoclub.com/tools/best-data-warehouse-software/
Ranks 20 tools, provides short blurbs and a comparison-style layout. More skimmable than others, but breadth comes at the cost of depth.
- https://www.geeksforgeeks.org/data-analysis/top-15-popular-data-warehouse-tools/
Introductory-level listicle. Covers a mix of warehouses, databases, and analytics tools. Educational but not detailed enough for buyers.
- https://rivery.io/data-learning-center/best-data-warehousing-tools/
Claims to be a “complete guide” with over 10 tools. Mostly generic descriptions, lacks comparison tables or strong evaluation criteria.
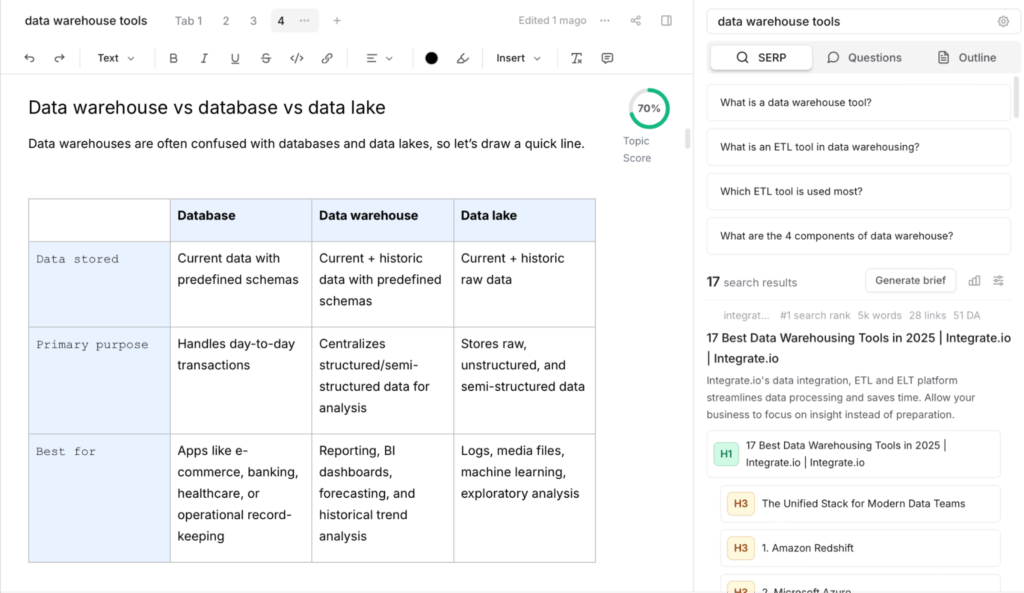
C. Plan of attack
Most results rely on lists + brief summaries; only The CTO Club article (which we may have also played a hand in 🤫) provides a structured comparison table. Few offer clear “how to choose” frameworks or FAQs.
Also, the current article spends too much time on lengthy explanations before even getting to the tools. That level of detail isn’t needed and is likely why it’s not ranking; the tools come too late in the flow.
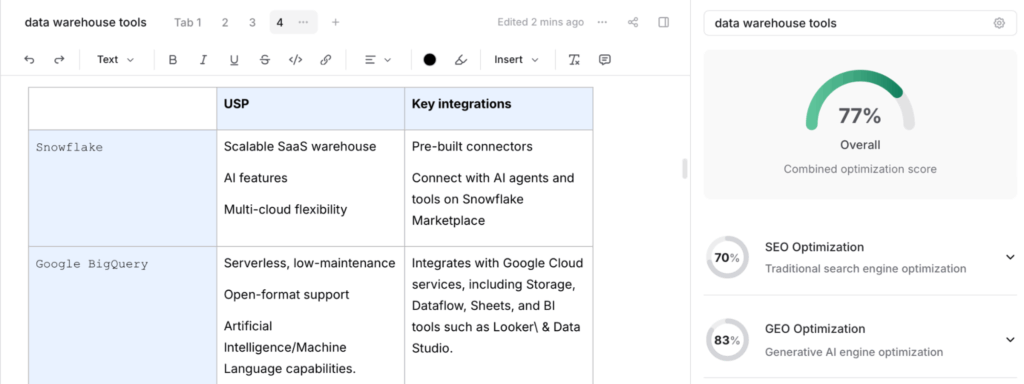
Our guide will:
- Stick to scope: Only true data warehouses, no ETL or storage platforms.
(We’ll include [redacted_client_name] in every tool section, explaining how it integrates with the warehouse tools) - Provide value with tables & scenarios: Feature-by-feature comparison table + “best for” blurbs.
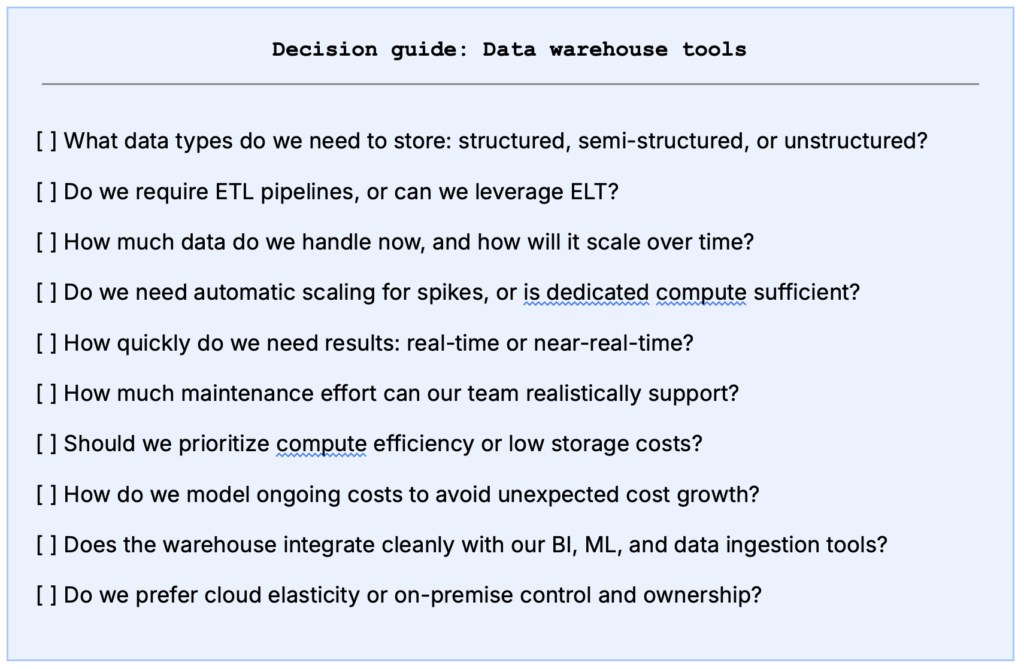
- Add buyer-centric guidance: Evaluation criteria, checklist, FAQs.
- Clarify [redacted_client_name] role: Sidebar on “Where ELT fits” with links to connectors.
- Freshness: Explicitly updated for 2025 + last updated date.
Got it? Good.
Now let’s implement these updates.
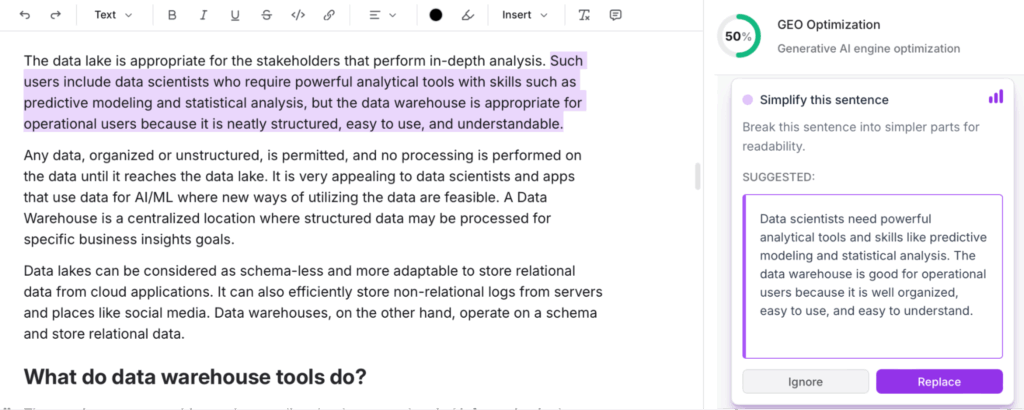
Step 4. Re-structuring, rewriting, and updating the content
This step is arguably the hardest but also the most important:
Get good writers to write.
Give them the information they need, in an easy-to-digest format. Help them with the nerdy specifics for search and LLM discovery. Then, step back and let them do what they’re good at.
In the end, the “content score” may not improve all that much. Because that’s not the main point.
Instead, the actual subjective-yet-instantly-noticable quality underwent a Beverly Housewives-style facelift:
Wait.
You mean to tell me you can actually get better-performing content by just, like, writing something other living and breathing human beings would actually be interested in reading?
Crazy, right?!
Plain English? Accurate information? Easy-to-read sentence structure?
Guess what also improved?
LLM visibility!

And citations:
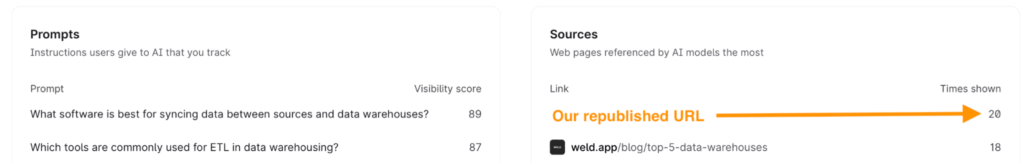
Turns out, there’s actually a LOT of overlap between:
- What readers actually want to find,
- What Google is trying to give them, and
- What LLMs are attempting to regurgitate
It’s almost as if… we should all be concentrating our efforts and attention on just doing more good shit. And the results often take care of themselves.
Step 5: Republish, and track performance by cohort
Content performance is always relative, because most isn’t written to “generate leads” or just “get traffic” by itself.
Instead, it’s usually a blend of all these to help meet people where they’re at and get them to eventually stick around. Long enough to consider purchasing, buy more often, or keep coming back for more (and thus extending their LTV).
So attribution should be added on the CRM level to consolidate multi-session data, and avoid getting sucked into just obsessing over top-funnel metrics (rankings) or bottom-funnel Google Analytics ones (last-touch leads).
BUT, let’s stick with the overall theme of search-focused performance in this scenario.
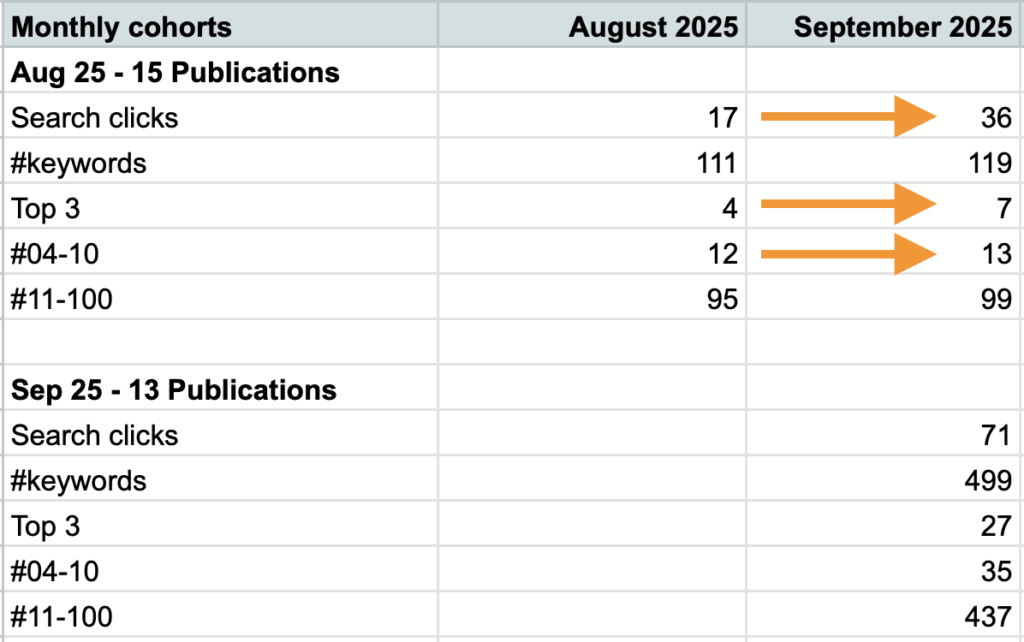
You should group your published and republished content into monthly cohorts. Then, monitor that performance over multiple months (if not years) so you can understand broader trends, while still being able to dig into the weeds when appropriate.
Notice the waterfall-y nature of this analysis by URL (and across each monthly cohort):
- Time to rank: going from not-indexed (net new) or previously low position (update existing) to upward momentum (ex. ~page two or higher),
- Number of ranking positions: Early leading indicators of momentum across multiple queries per URL, but sadly, getting more complicated due to Google’s recent,
- First page: Now we’re starting to gain some real traction that will begin delivering lagging indicators soon (ex. traffic),
- Top 3 positions: Visibility, brand awareness, and clicks start coming even (even if they’re depressed from previous heights),
- And last but not least, traffic. Which again is way more subjective than people think. A couple dozens clicks on a URL with commercial intent can translate into tens of thousands of conversion-assisting dollars for large brands
And it’s why going to all of this actual effort (not automated, sloppy button pushing) is ultimately worth it.
Because you’ll be able to start focusing more holistically on what’s working vs. what’s not, and how to course correct your strategy moving forward to do more of the former at the expense of the latter.
Conclusion
The key to recovering that traffic quickly is ruthless prioritization.
It’s about identifying the pages that matter most and understanding exactly why they’ve declined.
Hopefully, this guide outlines a model for efficiently diagnosing and fixing your biggest traffic opportunities.
These are almost always staring you in the face. IF, you just know what to look for and how to counter it.
Of course, rankings and traffic aren’t everything. Because at the end of the day, the KPI we’re optimizing for is brand growth and leads and sales over a long period of time.
But content, as with most things in life, is rarely a straight linear line.
So your focus should be on creating a self-reinforcing, self-correcting, durable, and sustainable content system over all other channel or time-specific “hacks.”
Because most of your competitors can’t or won’t. And that’s your opportunity at salvation.